Before we start
Data Carpentry contributors
Learning Objectives
- Describe the purpose of RStudio’s script, console, environment, and file/plot/help windows.
- Create an R project.
- Organize files and directories for a set of analyses as an R Project.
- Use the built-in RStudio help interface to search for more information on R functions.
Presentation of RStudio
Start RStudio – Let’s start by learning about our tool.
- Console, Scripts, Environments, Plots
- Code and workflow are more reproducible if we can document everything that we do.
- Our end goal is not just to “do stuff” but to do it in a way that anyone can easily and exactly replicate our workflow and results.
Before we get started
- Under the
Filemenu, click onNew project, chooseNew directory, thenEmpty project - Enter a name for this new folder, and choose a convenient location for it. This will be your working directory for the rest of the day (e.g.,
~/data-carpentry) - Confirm that the folder named in the
Create project as a sub-directory ofbox is where you want the working directory created. Use theBrowsebutton to navigate folders if changes are needed. - Click on “Create project”
- Under the
Filestab on the right of the screen, click onNew Folderand create a folder nameddatawithin your newly created working directory. (e.g.,~/data-carpentry/data) - Create a new R script (File > New File > R script) and save it in your working directory (e.g.
data-carpentry-script.R)
Your working directory should now look like this:
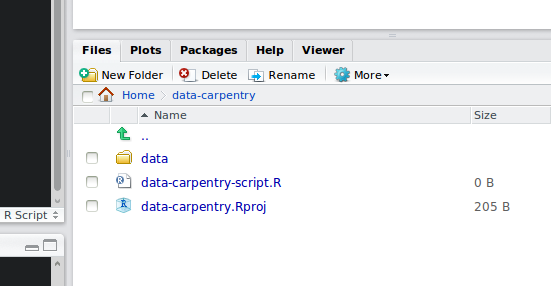
How it should look like at the beginning of this lesson
Interacting with R
There are two main ways of interacting with R: using the console or by using script files (plain text files that contain your code).
The console window (in RStudio, the bottom left panel) is the place where R is waiting for you to tell it what to do, and where it will show the results of a command. You can type commands directly into the console, but they will be forgotten when you close the session. It is better to enter the commands in the script editor, and save the script. This way, you have a complete record of what you did, you can easily show others how you did it and you can do it again later on if needed. You can copy-paste into the R console, but the Rstudio script editor allows you to ‘send’ the current line or the currently selected text to the R console using the Ctrl-Enter shortcut.
If R is ready to accept commands, the R console shows a > prompt. If it receives a command (by typing, copy-pasting or sent from the script editor using Ctrl-Enter), R will try to execute it, and when ready, show the results and come back with a new > prompt to wait for new commands.
If R is still waiting for you to enter more data because it isn’t complete yet, the console will show a + prompt. It means that you haven’t finished entering a complete command. This is because you have not ‘closed’ a parenthesis or quotation. If you’re in Rstudio and this happens, click inside the console window and press Esc; this should help you out of trouble.
Basics of R
R is a versatile, open source programming/scripting language that’s useful both for statistics but also data science. Inspired by the programming language S.
- Open source software under GPL.
- Superior (if not just comparable) to commercial alternatives. R has over 7,000 user contributed packages at this time. It’s widely used both in academia and industry.
- Available on all platforms.
- Not just for statistics, but also general purpose programming.
- For people who have experience in programmming: R is both an object-oriented and a so-called functional language
- Large and growing community of peers.
Organizing your working directory
You should separate the original data (raw data) from intermediate datasets that you may create for the need of a particular analysis. For instance, you may want to create a data/ directory within your working directory that stores the raw data, and have a data_output/ directory for intermediate datasets and a figure_output/ directory for the plots you will generate.
Data Carpentry,
2017-2018. License. Contributing.
Questions? Feedback?
Please file
an issue on GitHub.
On
Twitter: @datacarpentry