Introduction to automation
Overview
Teaching: 30 min
Exercises: 10 minQuestions
What tools will we be using?
How can we use these tools to improve reproducibility?
Objectives
Learn to use
R,RStudioandRMarkdown.Learn to create a
ProjectTemplatedirectory inR.
Prerequisites
Installation of R and RStudio:
- Download R from CRAN
- Download RStudio
- Install the following R packages:
tidyverse- contains a set of packages we will use.testthat- for unit testing.ProjectTemplate- to establish standard directory structure.rmarkdownandknitr(in RStudio pushing the knit HTML button the first time will prompt to have these packages installed).
- Note - you may need to tell
RStudioto useknitr, do this by:Preferences>Sweavefindweave Rnw files using:and selectknitr.- Distribute a Zip file that only contains the content of the example-manuscript folder from this repository.
- Explain what the handout file contains
Introduction to automation
“Reproduciibilty is actually all about being as lazy as possible!”
– Hadley Wickham (via Twitter, 2015-05-03)
Disclaimer
Depending on your previous experience with knitr, this lesson might seem too advanced as it provides ways to deal with annoyances you can face when you try to use knitr with a large project. If you have never used knitr before this is a good opportunity to learn efficient practices right away.
The main goal of this lesson is to teach you some tips and tricks that will make your life easier with knitr if you are using it in the context of a research project that involves multiple sources of raw data that are combined to create multiple intermediate datasets that are themselves combined to generate figures and tables.
You certainly don’t need to adopt all of these practices at once. Start small. Maybe with only one dataset, one figure first, and later learn how to use Make, and then Travis. None of these tools are exceedingly hard to learn or to grasp, but trying to learn everything at once might feel overwhelming. However, in the process of learning these tools, you will learn skills that you will be able to translate into other components of your research. For instance, if you are interested in learning how to write a package in R, many of the advice and tools included in this lecture will greatly help you to get started. If you start using Make and Travis, you will learn some basics of UNIX and Linux which are general useful skills to have if you are interested in analyzing large datasets (e.g., set up runs on an HPC cluster).
The issue(s)
knitr allows you to mix code and prose, which is wonderful and very powerful, but can be difficult to manage if you don’t have a good plan to get organized. The challenge with working in this reproducible framework is that you end up developing your analysis at the same time as you are writting your manuscript and refining your ideas, adjusting the aim of your paper, deciding on the data you are going to include, etc. It’s therefore important that you have a modular framework in place where each section of your analysis can be self-contained so you don’t depend on a linear script that will not reflect the complexity of your analysis.
A solution
In this lesson, I will demonstrate how to write your own functions to generate the clean version of your data, your figures, your tables and your manuscript. Having all the content of your manuscript as a function will greatly facilitate the upkeep of your manuscript as it forces to be organized. It also comes with some benefits:
- Modularity
- Less variables
- Better documentation
- Testing
Modularity
By breaking down your analysis into functions, you end up with blocks of code that can interact and depend on each others in explicit ways. It allows you to avoid repeating yourself, and you will be able to re-use the functions you create for other projects more easily than if your paper only contains scripts.
Fewer variables to worry about to focus on the important stuff
If your manuscript only contains scripts, you are going to accumulate many variables in your document and you are going to have to worry about avoiding name conflicts among all these temporary variables that store intermediate versions of your datasets but won’t need in your analysis. By putting everything into functions, these variables will be hidden from your global environment and you can focus on the important stuff: the inputs and the outputs of your workflow.
Functions that produce the variables, results, or figures you need in your manuscript allows you to track how your variables are related, which dataset depend on which one, etc.
Documenting your code
Ideally, your code should be written so that it’s easy to understand and your intentions are clear. However, what might seem clear to you now might be clear as mud 6 months from now or even 3 weeks from now. Other times, it might not seem very efficient to refactor a piece of code to make it clearer, and you end up with a piece of code that works but is klunky. If you thrive on geekiness and/or nerdiness you might endup over engineering a part of your code and make it more difficult to understand a few weeks later. In all of these situations, and even if you think your code is clear and simple, it’s important that you document your code and your functions, for your collaborators, and your future self.
If all your analysis is made up of scripts, with pieces that are repeated in multiple parts of your document, things can get out of hand pretty quickly. Not only is it more difficult to maintain because you will have to find and replace the thing that you need to change in multiple places of your code, but managing documentation is also challenging. Do you also duplicate your comments where you duplicate parts of your scripts? How do you keep the duplicated comments in sync? Re-organizing your scripts into functions (or organizing your analysis in functions from the beginning) will allow you to explicitly document the dataset or the parameters on which your function, and therefore your results, depends on.
The easiest way to document your code, is to add comments around your functions to explicitly indicate the purpose of each function, what the arguments are supposed to be (class and format) and the kind of output you will get from it.
You may also want to take advantage of roxygen, it’s a format that allows the documentation of functions, and it can easily be converted into the file formats used by R documentation. Writing for roxygen is not very different from simple comments, you just need to add some keywords to define what will end up in the different sections of the help files. This is not a strict requirement, and will it not make your analysis more reproducible, but it will be useful down the road if you think you will convert your manuscript into a package (see aside below). RStudio makes it easy to write roxygen. Once you have started writing a function, in the menu choose Code > Insert Roxygen Skeleton or type Ctrl + Alt + Shift + R on your keyboard.
When documenting your functions, it important to not only document the kind of input your function takes, but also the format and structure of the output.
Testing
When you start writing a lot of code for your paper, it becomes easier to introduce bugs. If your analysis relies on data that gets updated often, you may want to make sure that all the columns are there, and that they don’t include data they should not.
If these issues break something in your analysis, you might be able to find it easily, but more often than not, these issues might produce subtle differences in your results that you may not be able to detect.
If all your code is made up of functions, then you can control the input and test for the output. It is something that would be difficult if not impossible to do if all your analysis is in the form of a long script.
The package testthat provides a powerful and easy-to-use framework to build tests for your functions.
Should you make your manuscript and its functions into a package?
If your manuscript uses functions (which are properly documented and have tests) not only have you done most of the work required to have a functional R package, but you could be in a better position than many R packages.
Pros: common format, allows you to leverage the infrastructure for packages (tests, all functions are properly documented), can make sure it will work across platforms.
Cons: no good place for the manuscript text, you may have to dissociate code for functions and code for analysis.
Bottom line: it really depends on your type of paper, how much code there is in it, and whether others might end up re-using it. It’s not because your manuscript follows the conventions of a package that you need to submit to CRAN. If you have written functions that could be useful to the community, consider making those into a package.
Organizing your files
As you are writing the code for your manuscript, your life will be much easier if you spend time thinking about the organization of your files. File organization is a mix of conventions (e.g., you wouldn’t want to put your data in a folder called favorite_dog_pictures), requirements by other tools (e.g., when we will write tests later, the package we will use expects the tests to be in a folder named tests), and minimizing the impact of the quirks of your project/data on the time you spent writing code. You also need to be mindful, that during the life of your project you will probably go through several iterations of data exploration, and that your analysis will generate intermediate datasets (e.g., summaries by continent/year in our case) that might be computationally expensive to recreate, and that you don’t want to have to recreate everytime to build your manuscript. Additionally, it might also be useful to have the intermediate datasets, figures, and result tables, available independently from the manuscript so you can share them with your collaborators.
Thinking about these issues beforehand (and communicating about them with your collaborators) will save you time and headaches.
In this lesson, we are going to functionalize a knitr document that is more complex than what we have seen so far but not quite as complex as a “real” research document could look like. For this project, we will employ the ProjectTemplate package and apply a standardized set of directories to our reserch projects.
To run ProjectTemplate execute the following code:
library("ProjectTemplate")
create.project("Name of Project")
ProjectTemplate will then create a directory with the following structure:
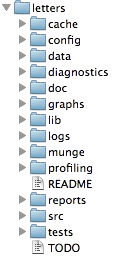
Default project layout:
data: the original raw data, you shouldn’t edit or otherwise alter any of the files in this folder. DATA ARE READ ONLY. If they are encoded in a supported file format, they’ll automatically be loaded when you callload.project().cache: Here is where you will store any data sets that (a) are generated during a preprocessing step and (b) don’t need to be regenerated every single time you analyze your data. You can use thecache()function to store data to this directory automatically. Any data set found in both the cache and data directories will be drawn fromcacheinstead ofdatabased on ProjectTemplate’s priority rules. We write them to.csvfiles (comma eperated values) so they are machine readable and can be easily shared.graphs: the folder where we can store the figures used in the project In our example, the figures are generated directly during the rendering of theRMardownfile for the manuscript, but having the figures as standalone files may facilitate getting feedback from your collaborators, or save time if you just work on tweaking its appearance without having to recompile the full manuscript.src: ourRcode (the functions that will generate the intermediate datasets, the analyses, and the figures), it’s often easier to keep the prose separated from the code. If you have a lot of code (and/or if the manuscript is long), it’s easier to navigate.tests: the code to test that our functions are behaving properly and that all our data is included in the analysis.- There are other directories that you may not need as a newcomer, but these will come on handy as you increase your knowledge and prowess with
R.
Key Points
R,RStudioandRMarkdownallow for powerful reproducible research.‘ProjectTemplate’ allows users to quickly and easily create a standardized directory structure for
Rprojects.